¿Cómo se calcula la tasa de crecimiento anual promedio o compuesta en Excel?
Este artículo explica cómo calcular la Tasa de Crecimiento Anual Promedio (TCAP) y la Tasa de Crecimiento Anual Compuesta (TCAC) en Excel.
- Calcular la tasa de crecimiento anual compuesta en Excel
- Calcular la tasa de crecimiento anual compuesta con la función XIRR en Excel
- Calcular la tasa de crecimiento anual promedio en Excel
Calcular la tasa de crecimiento anual compuesta en Excel
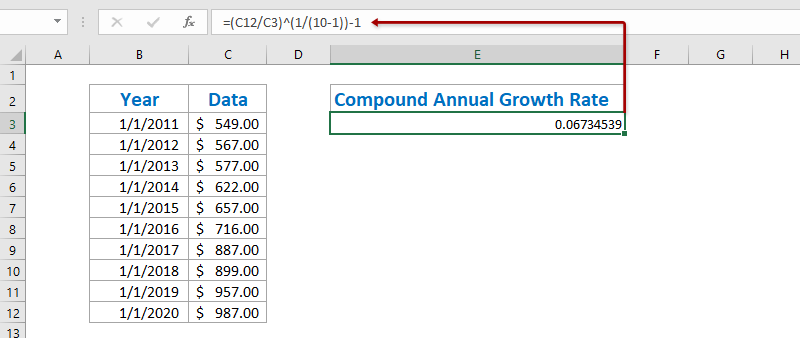
Para calcular la Tasa de Crecimiento Anual Compuesta en Excel, existe una fórmula básica: =((Valor final/Valor inicial)^(1/Períodos)-1). Y podemos aplicar fácilmente esta fórmula como se indica a continuación:
1. Seleccione una celda vacía, por ejemplo la celda E3, introduzca la siguiente fórmula y pulse la tecla Intro. Vea la captura de pantalla:
=(C12/C3)^(1/(10-1))-1
Nota: En la fórmula anterior, C12 es la celda que contiene el valor final, C3 es la celda que contiene el valor inicial y 10-1 representa el período transcurrido entre ambos valores; todos ellos pueden ajustarse según sus necesidades.
2. En algunos casos, el resultado del cálculo puede no mostrarse con formato de porcentaje. Seleccione el resultado del cálculo, haga clic en el botón Estilo de porcentaje situado en la ![]() pestaña Inicio y, a continuación, ajuste los decimales haciendo clic en el botón Aumentar decimales o en el botón
pestaña Inicio y, a continuación, ajuste los decimales haciendo clic en el botón Aumentar decimales o en el botón ![]() Disminuir decimales. Vea la captura de pantalla:
Disminuir decimales. Vea la captura de pantalla:
Calcular la tasa de crecimiento anual compuesta con la función XIRR en Excel
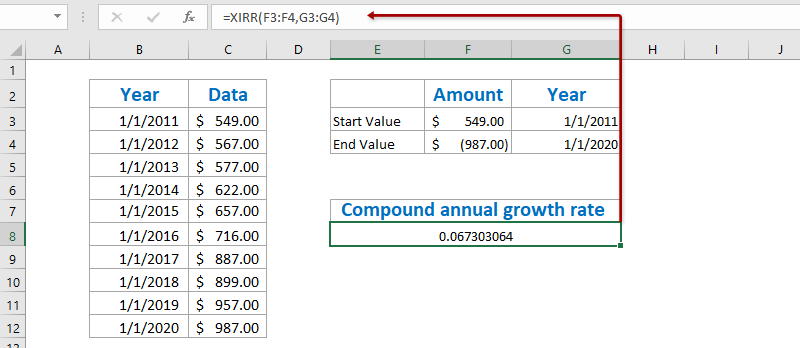
En realidad, la función XIRR nos permite calcular fácilmente la Tasa de Crecimiento Anual Compuesta en Excel, aunque requiere crear una nueva tabla con el valor inicial y el valor final.
1. Cree una nueva tabla con el valor inicial y el valor final, tal como se muestra en la primera captura de pantalla siguiente:
Nota: En la celda F3, introduzca =C3; en la celda G3, =B3; en la celda F4, =-C12; y en la celda G4, =B12. Alternativamente, puede ingresar directamente sus datos originales en esta tabla. Recuerde añadir un signo menos delante del valor final.
2. Seleccione una celda vacía debajo de esta tabla, introduzca la siguiente fórmula y pulse la tecla Intro.
=XIRR(F3:F4,G3:G4)
3. Para convertir el resultado al formato de porcentaje, seleccione la celda con la función XIRR, haga clic en el botón Estilo de porcentaje situado en la ![]() pestaña Inicio y, a continuación, ajuste los decimales haciendo clic en el botón Aumentar decimales o en el botón
pestaña Inicio y, a continuación, ajuste los decimales haciendo clic en el botón Aumentar decimales o en el botón ![]() Disminuir decimales. Vea la captura de pantalla:
Disminuir decimales. Vea la captura de pantalla:
Guarde rápidamente la tabla de TCA como una mini plantilla y reúsela con un solo clic en el futuro
¡Debe de resultar muy tedioso tener que hacer referencia a celdas y aplicar fórmulas cada vez para calcular promedios! Kutools para Excel ofrece una solución sencilla mediante la utilidad Texto automático para guardar el rango como una entrada de Texto automático, conservando así el formato de celda y las fórmulas del rango. ¡Así podrá reutilizar este rango con tan solo un clic!
Calcular la tasa de crecimiento anual promedio en Excel
Para calcular la Tasa de Crecimiento Anual Promedio en Excel, normalmente debes calcular primero las tasas de crecimiento anual de cada año con la fórmula = (Valor final - Valor inicial) / Valor inicial y, a continuación, promediar todas esas tasas. Sigue estos sencillos pasos:
1. Además de la tabla original, introduce la siguiente fórmula en la celda vacía C3 y arrastra el controlador de relleno hasta el rango C3:C11.
=(C4-C3)/C3
2. Seleccione el rango D4:D12, haga clic en el botón Estilo de porcentaje situado en la ![]() pestaña Inicio y, a continuación, ajuste los decimales haciendo clic en el botón Aumentar decimales o en el botón
pestaña Inicio y, a continuación, ajuste los decimales haciendo clic en el botón Aumentar decimales o en el botón ![]() Disminuir decimales. Vea la captura de pantalla:
Disminuir decimales. Vea la captura de pantalla:
3. Calcule el promedio de todas las tasas de crecimiento anual introduciendo la siguiente fórmula en la celda F4 y pulsando la tecla Intro.
=PROMEDIO(D4:D12)
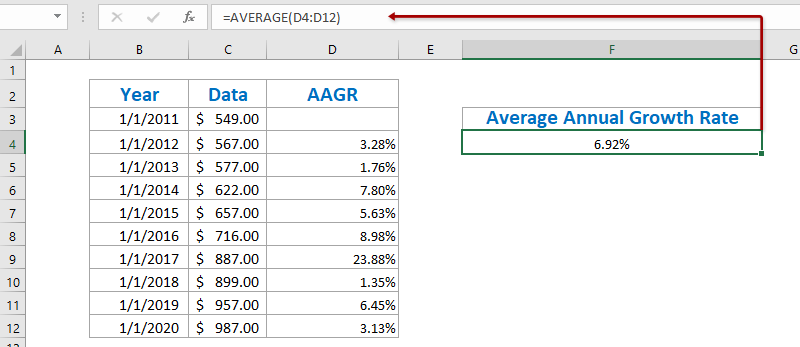
Hasta ahora, la Tasa de Crecimiento Anual Promedio ya se ha calculado y aparece en la celda C12.
Demostración: calcular la tasa de crecimiento anual promedio/compuesta en Excel
Artículos relacionados:
Las mejores herramientas de productividad para Office
Potencie sus habilidades en Excel con Kutools para Excel y experimente una eficiencia como nunca antes.Kutools para Excel ofrece más de 300 funciones avanzadas para aumentar su productividad y Ahorrar tiempo.Haga clic aquí para obtener la función que más necesita...
Office Tab aporta una interfaz con pestañas a Office y hace que su trabajo sea mucho más fácil
- Active la edición y lectura con pestañas en Word, Excel, PowerPoint, Publisher, Access, Visio y Project.
- Abra y cree varios documentos en nuevas pestañas dentro de la misma ventana, en lugar de hacerlo en ventanas separadas.
- ¡Aumente su productividad en un 50 % y elimine cientos de clics del ratón cada día!
Todos los complementos de Kutools en un solo instalador.
Kutools for Office es la suite que incluye complementos para Excel, Word, Outlook y PowerPoint, además de Office Tab Pro, ideal para equipos que trabajan en distintas aplicaciones de Office.
- Suite integral— complementos para Excel, Word, Outlook y PowerPoint + Office Tab Pro
- Un instalador, una licencia— configuración en minutos (compatible con MSI)
- Rendimiento mejorado en conjunto— productividad optimizada en todas las aplicaciones de Office
- Prueba gratuita de 30 días con todas las funciones— sin registro ni tarjeta de crédito
- La mejor relación calidad-precio— ahorre frente a la compra individual de complementos