¿Cómo crear un gráfico en Excel con fecha y hora en el eje X?
En Excel, normalmente insertamos un gráfico para describir mejor los datos. Pero en algunos casos, al crear un gráfico de columnas/barras/líneas basado en una serie de fechas y horas, el eje X del gráfico puede aparecer como se muestra en la captura de pantalla siguiente. En este artículo explico cómo mostrar correctamente la fecha y la hora en el eje X del gráfico.
Cree un gráfico con fecha y hora correctamente en el eje X
 Cree un gráfico con fecha y hora correctamente en el eje X
Para mostrar la fecha y la hora correctamente, solo tiene que cambiar una opción en el cuadro de diálogo Formato de eje.
1. Haga clic con el botón derecho en el eje X del gráfico y seleccione Formato de eje en el menú contextual. Vea la captura de pantalla:
2. A continuación, en el panel Formato de eje o en el cuadro de diálogo Formato de eje, vaya a la pestaña Opciones del eje y active la opción Eje de texto en la sección Tipo de eje. Vea la captura de pantalla:
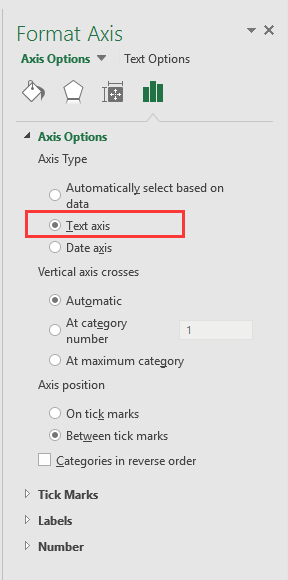
Si utiliza una versión de Excel posterior a 2010, aparecerá un panel Formato de eje; active la opción Eje de texto en Tipo de eje, dentro del grupo Opciones del eje.
3. Haga clic en Cerrar o vuelva al gráfico; así, los datos de fecha y hora se mostrarán correctamente en el eje X. Vea la captura de pantalla:
¡Cree un gráfico de velocímetro en solo dos sencillos pasos! |
| Si desea utilizar un gráfico de velocímetro para mostrar el progreso de un proyecto, crear uno en Excel puede resultar complejo y llevar mucho tiempo. La herramienta de Kutools para Excel simplifica este proceso, permitiéndole crear un gráfico de velocímetro profesional en solo dos sencillos pasos.¡Descárguelo ahora!. |
 |
Las mejores herramientas de productividad para Office
Potencie sus habilidades en Excel con Kutools para Excel y experimente una eficiencia como nunca antes.Kutools para Excel ofrece más de 300 funciones avanzadas para aumentar su productividad y Ahorrar tiempo.Haga clic aquí para obtener la función que más necesita...
Office Tab aporta una interfaz con pestañas a Office y hace que su trabajo sea mucho más fácil
- Active la edición y lectura con pestañas en Word, Excel, PowerPoint, Publisher, Access, Visio y Project.
- Abra y cree varios documentos en nuevas pestañas dentro de la misma ventana, en lugar de hacerlo en ventanas separadas.
- ¡Aumente su productividad en un 50 % y elimine cientos de clics del ratón cada día!
Todos los complementos de Kutools en un solo instalador.
Kutools for Office es la suite que incluye complementos para Excel, Word, Outlook y PowerPoint, además de Office Tab Pro, ideal para equipos que trabajan en distintas aplicaciones de Office.
- Suite integral— complementos para Excel, Word, Outlook y PowerPoint + Office Tab Pro
- Un instalador, una licencia— configuración en minutos (compatible con MSI)
- Rendimiento mejorado en conjunto— productividad optimizada en todas las aplicaciones de Office
- Prueba gratuita de 30 días con todas las funciones— sin registro ni tarjeta de crédito
- La mejor relación calidad-precio— ahorre frente a la compra individual de complementos